Which stock screeners actually performed? The first month of data
Every stock screener shows you a list of tickers that pass some filter. Almost none of them show you whether those picks went on to make money. That gap is the whole reason this project exists. I log the daily picks of 20+ screening strategies and then track how each batch performs forward over time.
The first full month of data is in. Here's what it shows, what stood out, and (just as importantly) why I don't trust it yet.
How this was measured
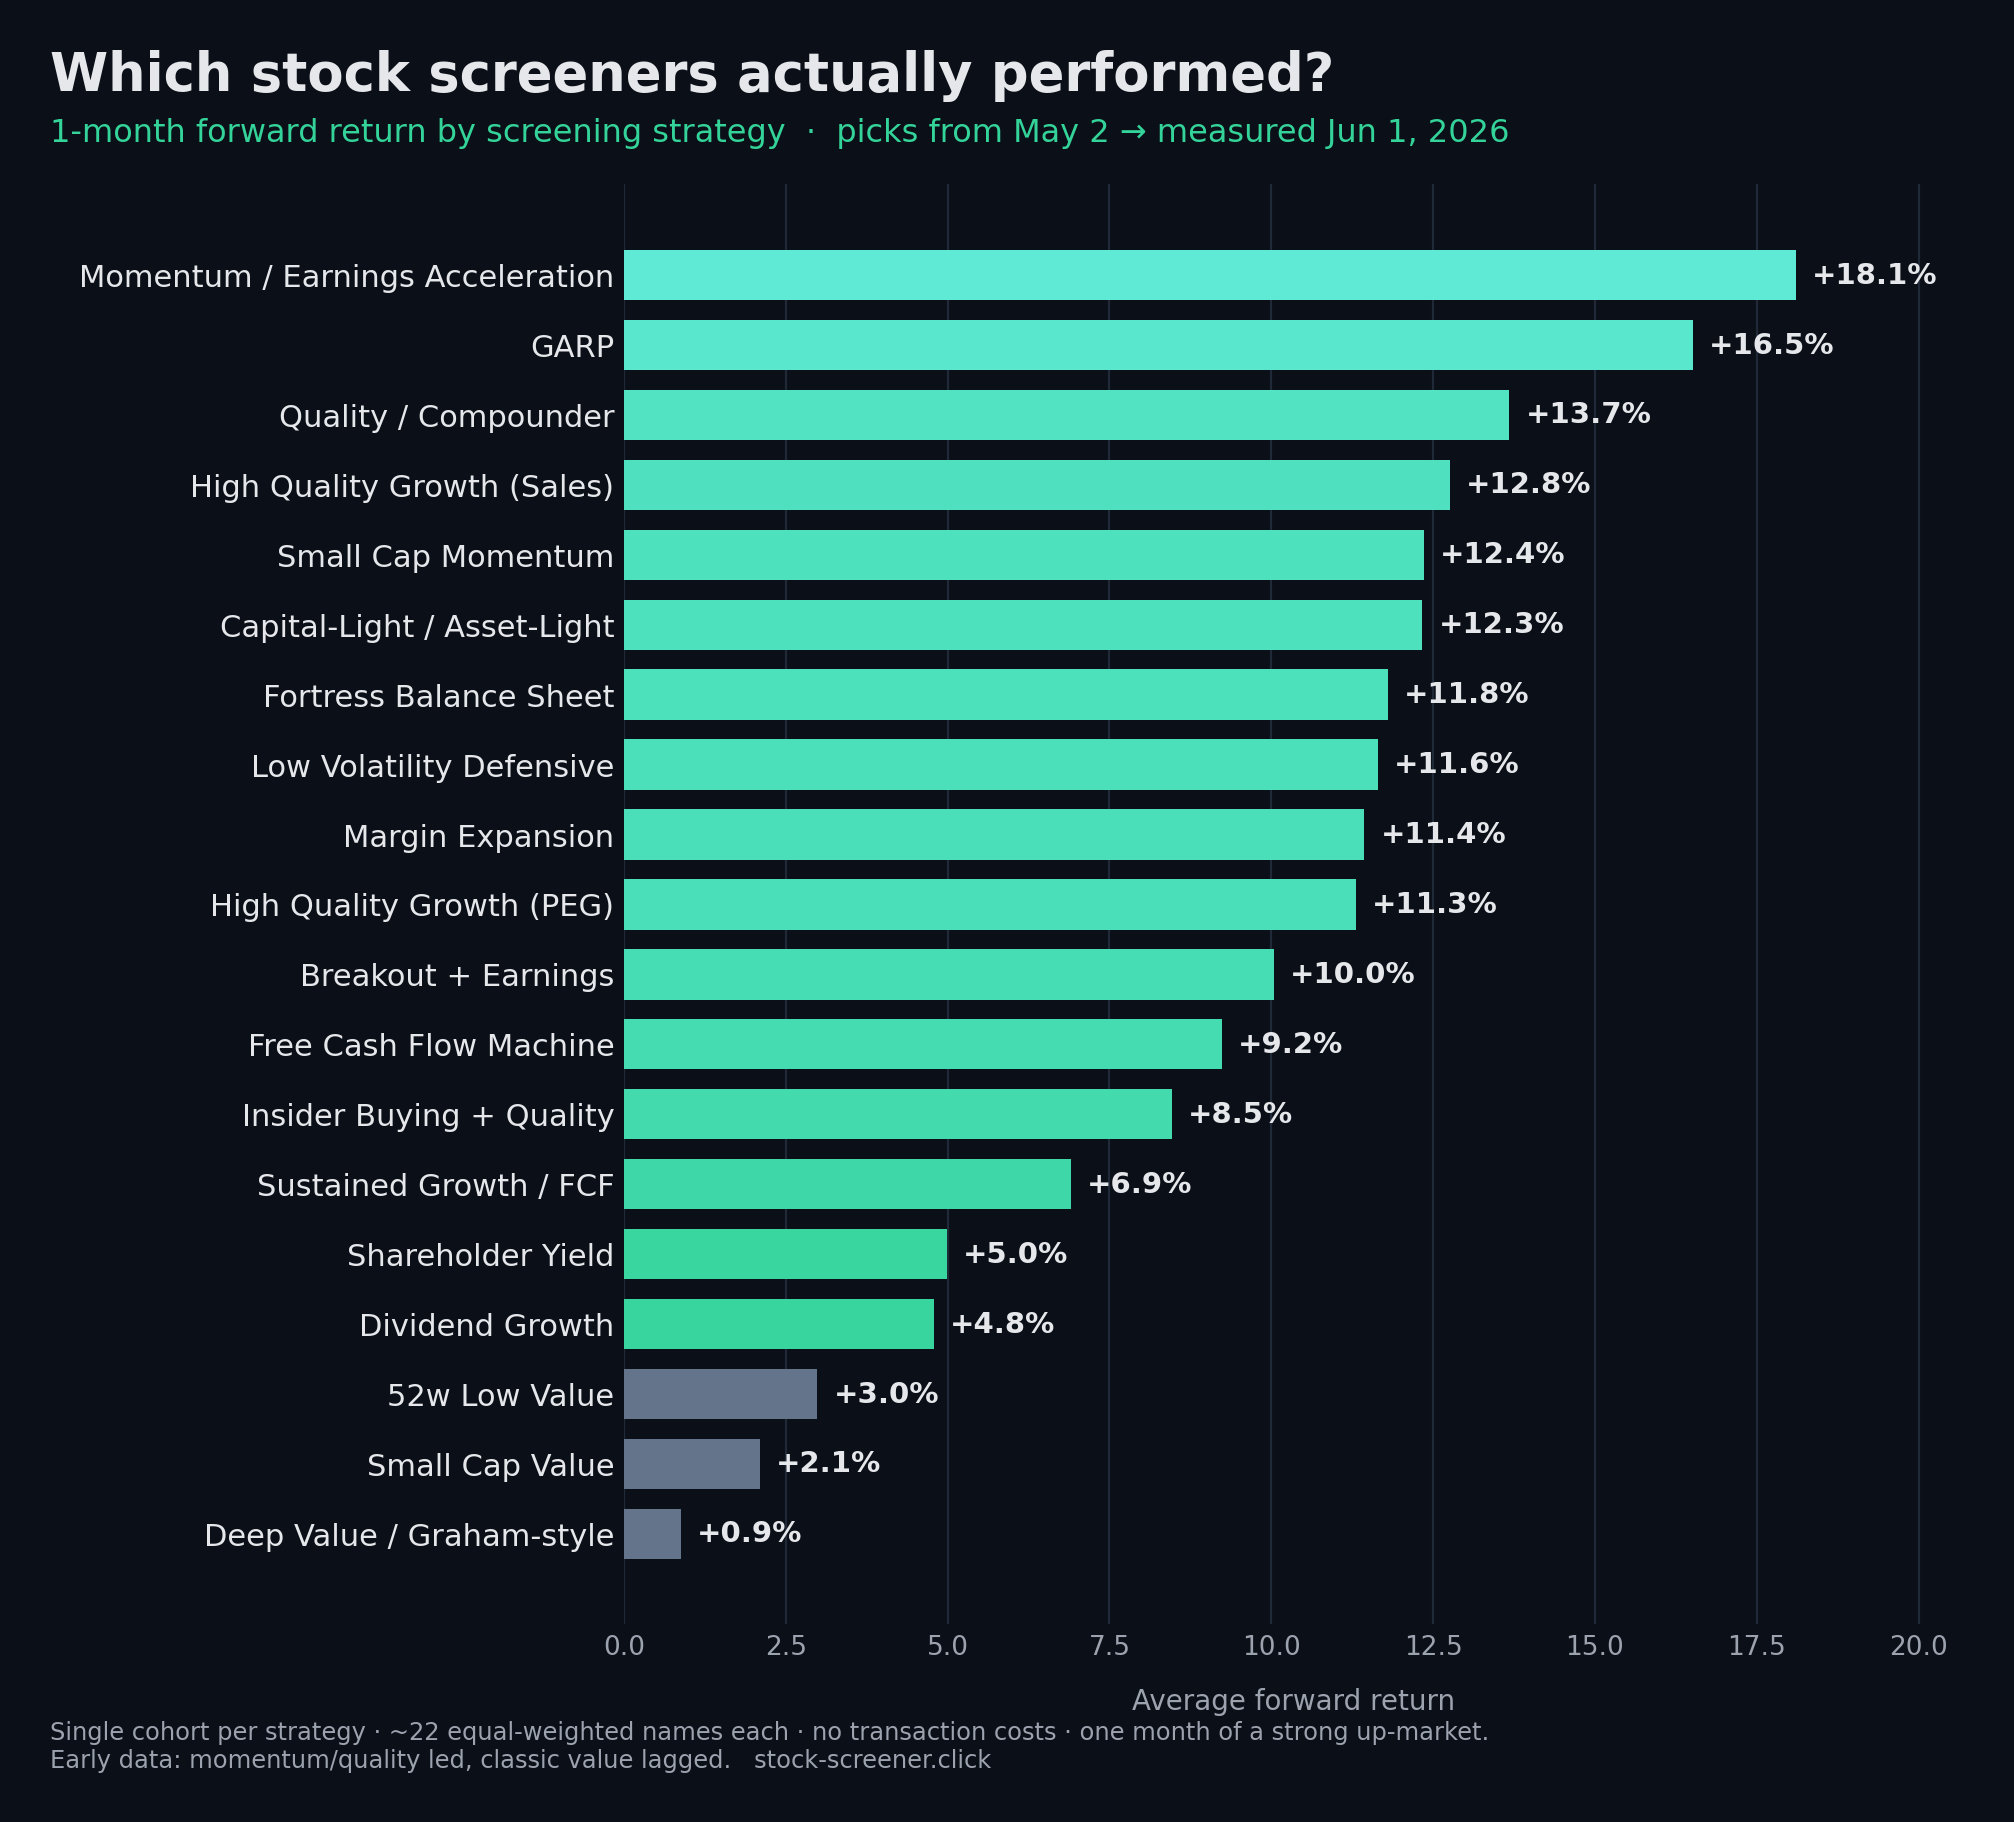
For each strategy I take the cohort of tickers it picked on a given date, enter at the first available close after that date, and measure the average percent return to the latest close. The numbers below come from picks made on May 2, 2026, measured to June 1, 2026, roughly a one-month forward window. Each cohort is about 22 equal-weighted names.
The full leaderboard
| # | Screening strategy | 1-mo return |
|---|---|---|
| 1 | Momentum / Earnings Acceleration | +18.1% |
| 2 | GARP | +16.5% |
| 3 | Quality / Compounder | +13.7% |
| 4 | High Quality Growth (Sales) | +12.8% |
| 5 | Small Cap Momentum | +12.4% |
| 6 | Capital-Light / Asset-Light | +12.3% |
| 7 | Fortress Balance Sheet | +11.8% |
| 8 | Low Volatility Defensive | +11.6% |
| 9 | Margin Expansion | +11.4% |
| 10 | High Quality Growth (PEG) | +11.3% |
| 11 | Breakout + Earnings | +10.0% |
| 12 | Free Cash Flow Machine | +9.2% |
| 13 | Insider Buying + Quality | +8.5% |
| 14 | Sustained Growth / FCF | +6.9% |
| 15 | Shareholder Yield | +5.0% |
| 16 | Dividend Growth | +4.8% |
| 17 | 52w Low Value | +3.0% |
| 18 | Small Cap Value | +2.1% |
| 19 | Deep Value / Graham-style | +0.9% |
What stood out
- Momentum and quality/growth led the pack. Earnings-acceleration momentum topped the board at +18.1%, with GARP and Quality/Compounder close behind.
- Classic value lagged hard. Deep Value (Graham-style) barely cleared zero at +0.9%, and small-cap and 52-week-low value weren't far ahead. In the shorter ~2-week window, Deep Value was actually negative.
- Defensives near the top is a tell. "Low Volatility Defensive" putting up +11.6% says this was a broad risk-on month: beta was being rewarded across the board.
What's next
The interesting question isn't "who won last month," it's "who wins consistently." The next piece looks at forward returns across every past pick date for each strategy, so we can see which screeners hold up across different conditions rather than catching one good tape. I'm also digging into whether consensus picks (tickers selected by several independent strategies at once) beat any single screener.
Want the data behind this?
Daily picks, consensus signals, and cohort-based performance, all as a simple JSON API, with a free tier.
Get it on RapidAPI →